
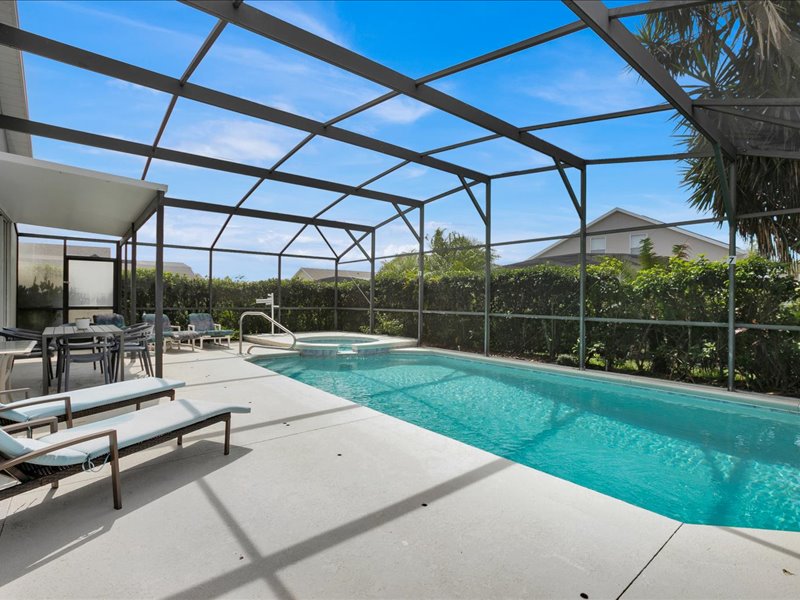
Home story · Glenbrook, Clermont, Florida
Poolside Villa | A LoveRentals property story
Poolside Villa earned $26,567 in Jan–Sep 2026, up 36.3% from 2025.
36.3% more booked nightly revenue
Jan–Sep 2025 → Jan–Sep 2026
Read the story →
Market comparison · Orlando, Florida · January–August 2026 (occupancy)
From January through August 2026, LoveRentals homes in Orlando reported 64.5% adjusted occupancy against 42.0% for the market—a 22.5 percentage-point gap.
LoveRentals homes vs the Orlando market
64.5% vs 42.0%
Adjusted occupancy
January–August 2026 (occupancy)
+53.6% relative lift, calculated from these values. +22.5 pp difference.
Revenue per unit
+10%
Lead time
+202%
Length of stay
+84%
LoveRentals vs Orlando market · January–August 2026 (occupancy) · Source: Wheelhouse market data, reported by LoveRentals · Occupancy aggregates are source-reported for Jan–Aug 2026, not calculated from monthly rows. Revenue, lead-time and stay-length figures are printed comparisons; their precise reporting period was not confirmed.
% · January–August 2026 (occupancy) · LoveRentals homes vs the Orlando market
LoveRentalsOrlando market
Adjusted occupancy by month. The two series follow the same seasonal shape, with LoveRentals homes peaking in Jul 2026 and the widest gap in Jul 2026. Period figures: LoveRentals 64.5%, Orlando market 42.0%.
Source: LoveRentals performance screenshots, citing Wheelhouse · January–August 2026 (occupancy)
LoveRentals led the market in every reported month from January through August, reaching 80.3% adjusted occupancy in July versus 47.3% for the market. Even in May, the narrowest gap, 38.7% versus 35.06% kept LoveRentals ahead by 3.64 percentage points.
Listing examples from the guest site. They show presentation only — the figures above are portfolio-level, not results for the pictured homes.

A five-bedroom resort pool home marketed by LoveRentals. Opens the current listing on our guest site.
View listing: Modern Paradiso Grande pool home (opens the guest site in a new tab)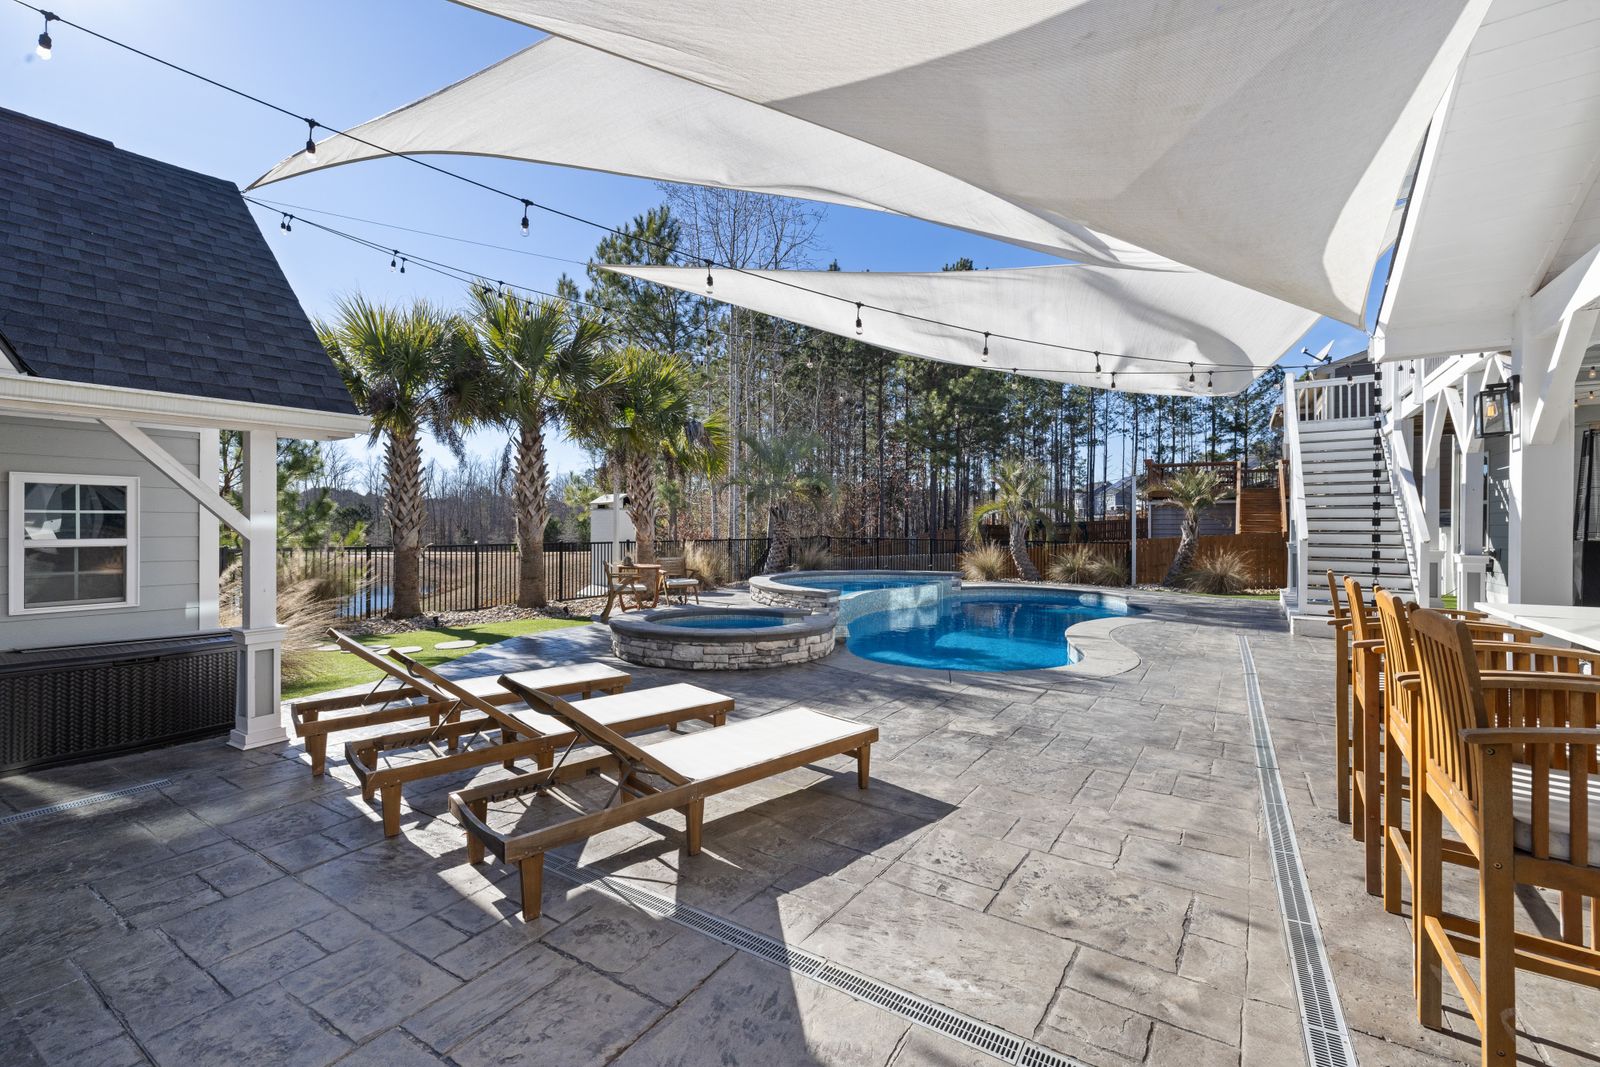
Daylight pool photos, the heating option, and the outdoor seating are up front, because that’s the first thing Orlando families look for.
Explore homes in Orlando: Pools, shown at their best (opens the guest site in a new tab)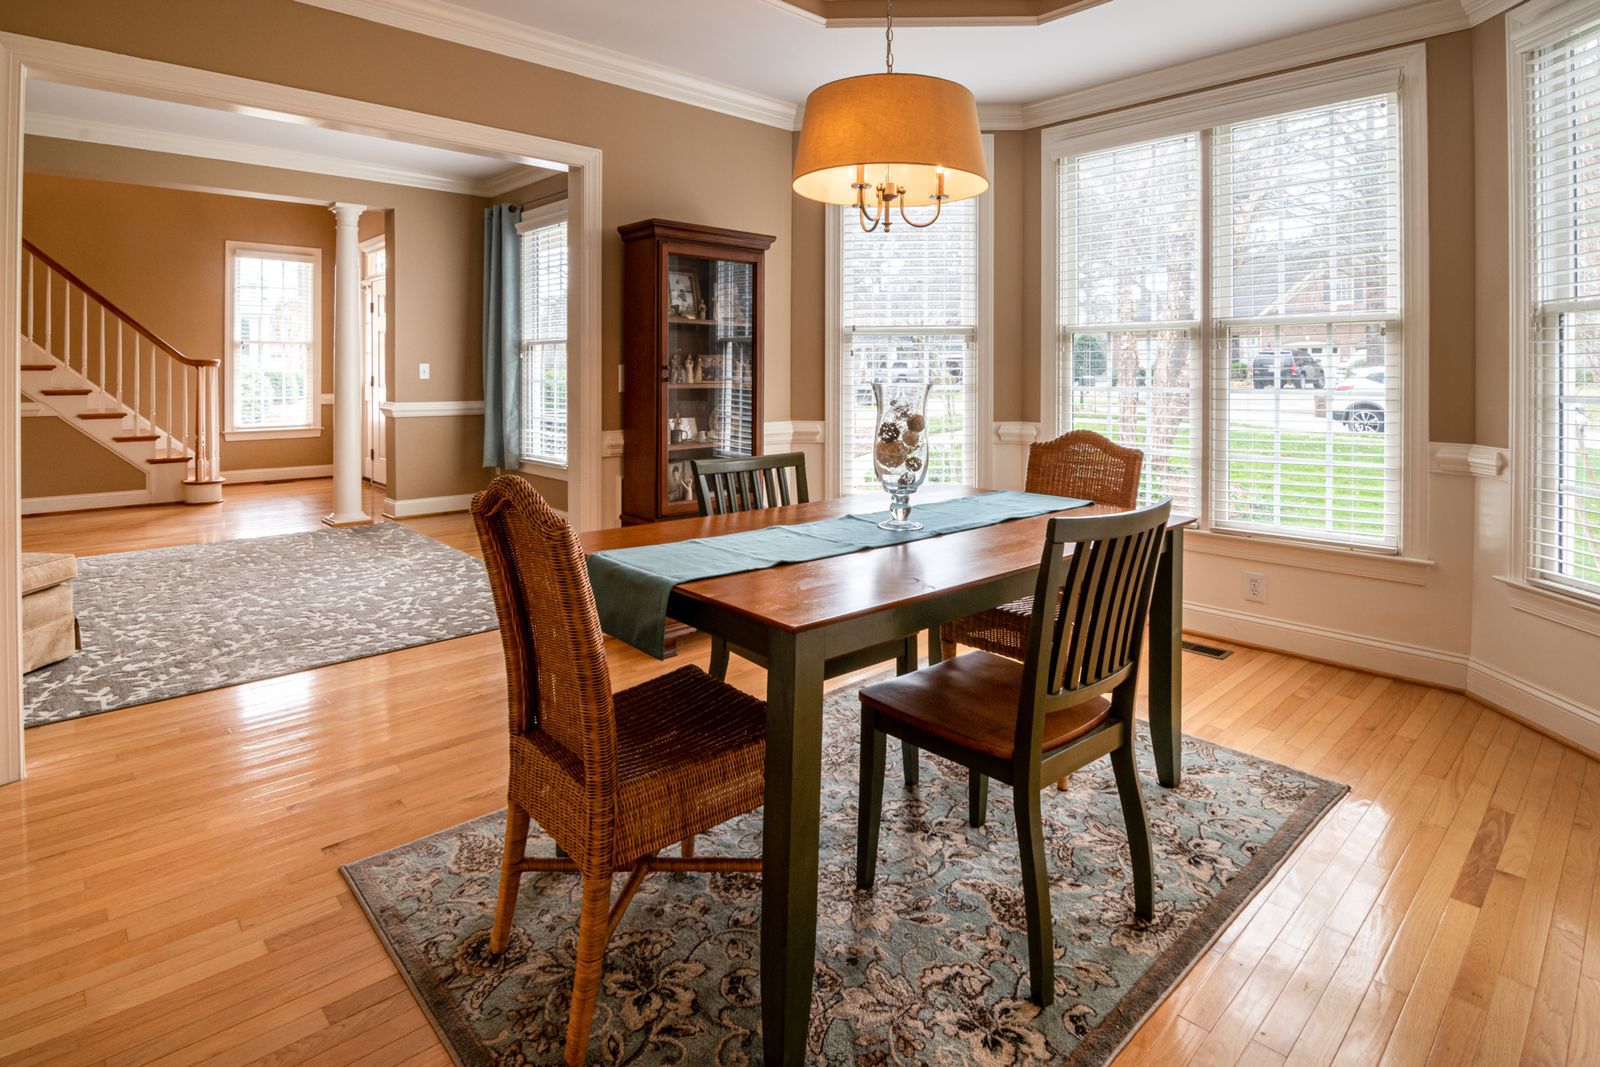
Bedrooms, bunk rooms, dining seats and quiet corners are spelled out so multi-family groups can picture the week.
Explore homes in Orlando: Room for everyone (opens the guest site in a new tab)We handle the online and phone work, so you can focus on the property and the on-site experience.
Home story · Glenbrook, Clermont, Florida
Poolside Villa earned $26,567 in Jan–Sep 2026, up 36.3% from 2025.
36.3% more booked nightly revenue
Jan–Sep 2025 → Jan–Sep 2026
Read the story →Home story · Davenport area, Florida
Fifty additional booked nights and a higher average rate show how a condo can improve without relying on a luxury-home price point.
40.3% more booked nightly revenue
January 1–September 30, 2025 → January 1–September 30, 2026
Read the story →Home story · Davenport, Florida
Castaway Breeze more than doubled booked nights while its average booked nightly rate was modestly lower.
95.5% more booked nightly revenue
January 1–September 30, 2025 → January 1–September 30, 2026
Read the story → Article cover unavailable
A consistent Airbnb cleaning checklist is less about the scrubbing itself and more about building a system that produces the same guest-ready result no matter who's holding the mop. Treat this guide as your working standard, adapt it to your property's specific features, and pair it with photo documentation so every turnover is both spotless and provable.
 Article cover unavailable
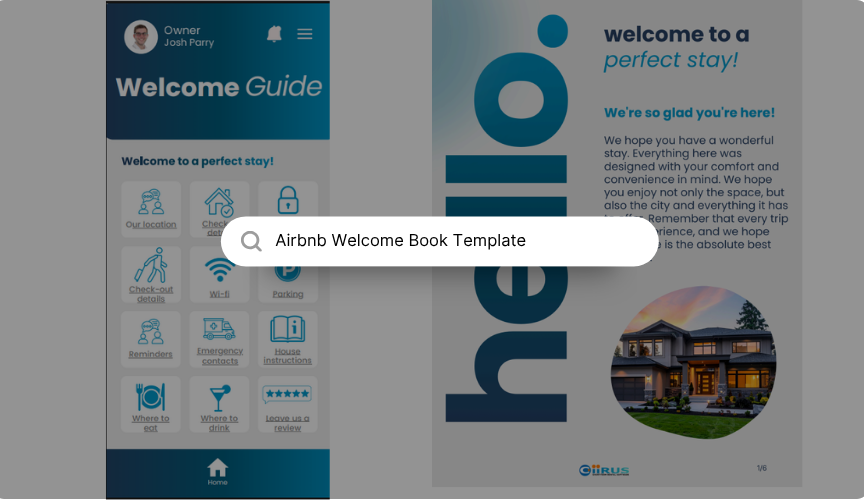
A welcome book template is a reusable, pre-built guide — digital or printed — that you fill in once per property and hand to every guest. The point of using a template rather than writing one from scratch is consistency: the same sections, in the same order, every time, so nothing important gets forgotten on a rushed turnover day.
 Article cover unavailable
What Today's Guests Actually Expect (and How to Deliver at Scale)
LoveRentals brings together thoughtful pricing, compelling listings, broad distribution and attentive guest support to help your home reach more travelers and turn interest into bookings. Let's explore a rental strategy tailored to your property and goals.